Cuda API
创建对象:
#include <cuda_runtime.h>
#include <cuda.h>
#include <iostream>
#include <string>

// 获取当前机器的GPU数量
cudaError_t error_id = cudaGetDeviceCount(&deviceCount);

for (int dev = 0; dev < deviceCount; ++dev) {
    cudaSetDevice(dev);
    // 初始化当前device的属性获取对象
    cudaDeviceProp deviceProp;
    cudaGetDeviceProperties(&deviceProp, dev);

    printf("\nDevice %d: \"%s\"\n", dev, deviceProp.name);
拿到数据后可以查看对应feature
printf("  Total amount of shared memory per block:       %zu bytes\n",  deviceProp.sharedMemPerBlock);
printf("  Total shared memory per multiprocessor:        %zu bytes\n",  deviceProp.sharedMemPerMultiprocessor);
printf("  Total number of registers available per block: %d\n",         deviceProp.regsPerBlock);
printf("  Warp size:                                     %d\n",         deviceProp.warpSize);
printf("  Maximum number of threads per multiprocessor:  %d\n",         deviceProp.maxThreadsPerMultiProcessor);
printf("  Maximum number of threads per block:           %d\n",         deviceProp.maxThreadsPerBlock);
printf("  Max dimension size of a block size (x,y,z): (%d, %d, %d)\n",  deviceProp.maxThreadsDim[0], deviceProp.maxThreadsDim[1],
           deviceProp.maxThreadsDim[2]);
printf("  Max dimension size of a grid size   (x,y,z): (%d, %d, %d)\n", deviceProp.maxGridSize[0], deviceProp.maxGridSize[1],
           deviceProp.maxGridSize[2]);
参考代码:
CUDATutorial/4_device_query.cu
nsys
Pytorch
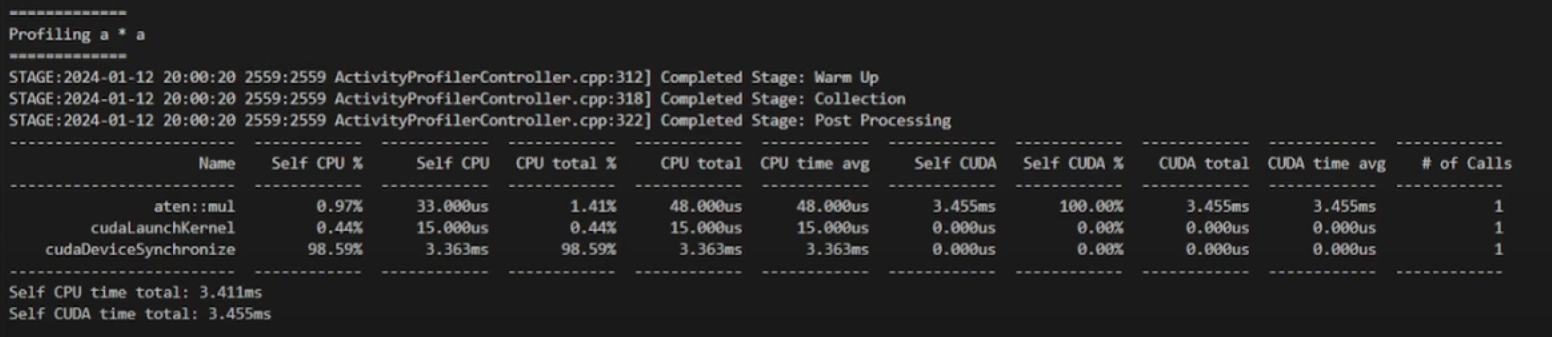
autograd.profile
toy function如下:
def square_2(a):
    return a * a

print("=============")
print("Profiling a * a")
print("=============")

with torch.autograd.profiler.profile(use_cuda=True) as prof:
    square_2(b)

print(prof.key_averages().table(sort_by="cuda_time_total", row_limit=10))
export_chrome_trace
本质上就是profile后pytorch会输出一个json,把这个json拖到chrome里就可以可视化了
with profile(activities=[ProfilerActivity.CPU, ProfilerActivity.CUDA]) as prof:
    for _ in range(10):
        a = torch.square(torch.randn(10000, 10000).cuda())

prof.export_chrome_trace("trace.json")
参考文献:
profiling-cuda-in-torch/pytorch_square.py
nsight computer
computer bound & memory bound & latency bound
ncu里的GPU speed of light throughput
- 柱状图
- 矩阵乘法必然需要computer大,但不是越大越好,反过来不成立
- float point operations Roofline
ncu_log
ncu --set full -o output $(which python) train.py
使用ncu进行profile输出之后,基本上可以看到每个模块都是三部分组成:
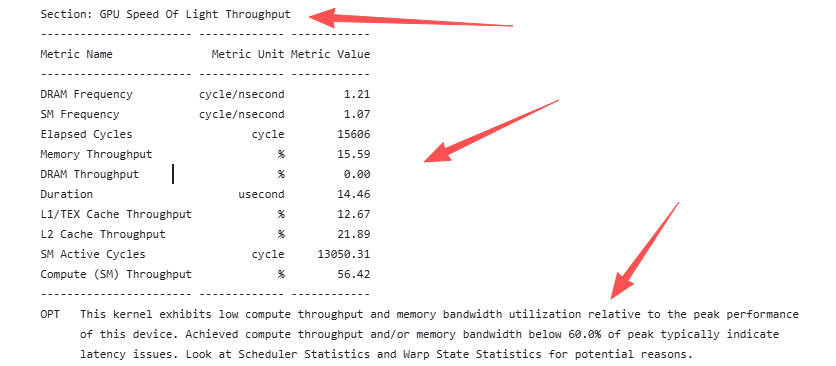
- 首先是该模块的名称
- 然后是表格进行量化
- 最后的OPT是建议
各种参数的计算
GPU峰值性能
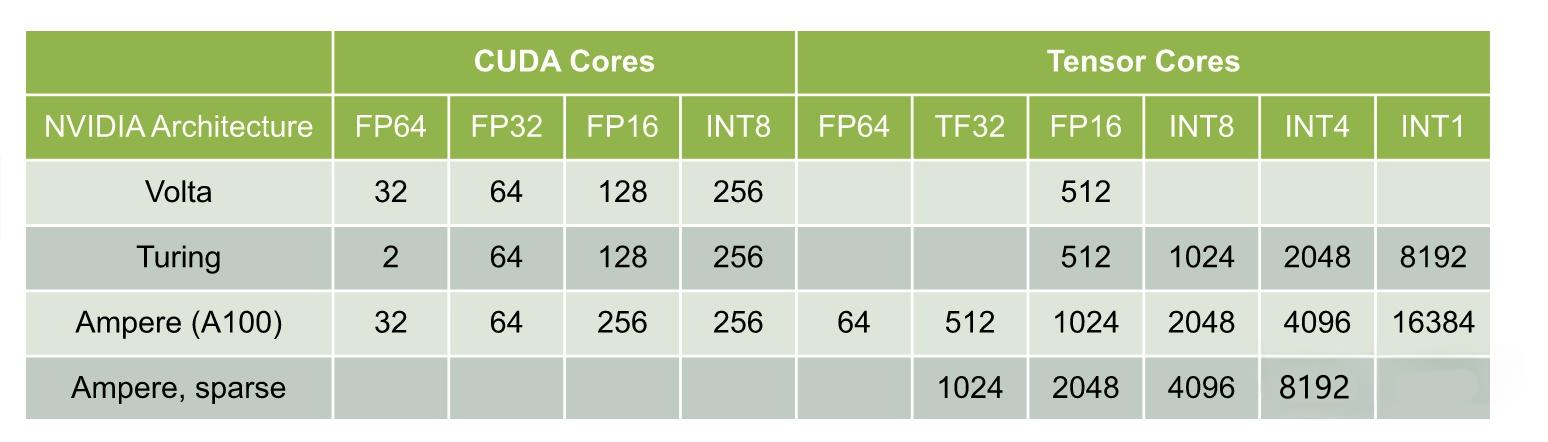
$$
PeakFLOPS=F_{clk}*N_{SM}*T_{ins}*2
$$
其中:
- $F_{clk}$为SM的频率
- $N_{SM}$为SM的个数
- $T_{ins}$为上面的指令吞吐
参考: